Latest News:Index Copernicus Value (ICV) for 2013 was 3.59; 2014 was 58.17; 2015 was 64.83 and in 2016 is 79.75
Research Article - (2023) Volume 11, Issue 1
The objective of the study was to compare the bio-digestion of peelings and effluents, by products of the transformation of cassava into gari in southern Benin. The experimental device was a Ficher block comprising the following seven treatments, all with the addition of 400 g of water: 1st treatment (T1) composed of 400 g of crushed cassava peelings; T2 composed of 300 g of peelings and 100 g of cow dung; T3 composed of 200 g of peelings and 200 g of cow dung; T4 composed of 400 g of effluent; T5 composed of 300 g of effluent and 100 g of cow dung; T6 composed of 200 g of effluent and 200 g of cow dung; T7 or control (T0 composed of 400 g of cow dung. The results showed that the biogas volume averages of the treatments T0, T1, T2, T3, T4, T5 and T6 were respectively of the order of 40.74 ml on the 25th day, 11.74 ml on the 33rd day, 13.48 ml on the 31st day, 22.61 ml on the 29th day, 24.35 ml on day 27, 23.04 ml on day 27 and 34.13 ml on day 21. The variance homogeneity test (p=1.15.E-05) carried out revealed a significant difference between the average volumes of biogas However, multiple comparison tests reveal that T6 provides better biogas performance than T0.
Renewable energy; Co-digestion; Cassava waste; Cow dung; Digester; Biogas
Cassava (Manihot esculenta Crantz) is one of the important sources of energy in the diet of tropical regions. It is one of the main starchy root and tuber crops grown in the world [1]. Africa is the world's leading producer of cassava with a production of more than 145 million tons in 2011 [2], almost all of which is used as a subsistence crop par excellence and is devoted to feeding the population. In Benin, cassava is one of the most important crops, with production estimated at over 3.6 million tons in 2011 [2]. The processing of this crop generates large quantities of waste. This waste is mainly peelings. Benin is one of the 20 main cassava consuming countries in the world with 1.6 million tons used in human food [3]. The waste from the processing of cassava (into gari, tapioca, Lafu in Benin) is essentially the peelings and the effluents from the pressing of the pulp. The processing of one ton of cassava generates 275 kg of cassava peelings. These peels are energetic and can be used to produce gas and biochar [4]. With a calorific value of 18 MJ/kg [5], the energy that can be generated from this biomass is approximately 32,400 MJ per year. Paradoxically, the actors of this sector are often confronted with difficulties of access to energy. The effluents are rich in organic matter [6] and very toxic due to the high cyanide content [7]. Cassava peelings and effluents are waste that is mostly dumped near urban areas, poured into the streets and constitute large piles of garbage that are often burned, cluttering up households and constituting a real problem for the environment and the health of the population. But what to do with this waste that pollutes the environment? To answer this question, we conducted a compara-tive study of bio-digestion of cassava peelings and effluent in the laboratory.
The biomasses used in this study are cassava peelings, effluents from cassava pressing and cow dung. Cassava peels and effluents were collected from the "Massavo" group in the commune of Ifangni in southern Benin. Cow dung was collected at the slaughterhouse of the Songhai Center in Porto-Novo, Benin. The bib-liographic research made it possible to collect the results of immediate analysis of the biomasses used (Table 1) [5,7,8].
| Parameter | Cassava peel Source [5] |
Cow mouth Source [7,8] |
Cassava Effluent Source [7] |
|---|---|---|---|
| pH | 5 | 8-9 | 3-4.2 |
| Moisture (%) | 74 | 80.59 | - |
| Volatile matter rate (%) | 73.3 | 89 | - |
| Carbone content (%) | 22.8 | 49.20 | - |
| Ash content (%) | 3.8 | 42 | - |
| C/N | - | 19 | - |
Table 1: Physicochemical parameters of the biomasses used.
The setup is composed of six treatments and a control treatment. Each treatment is composed of a substrate of 800g. The first treatment (T1) is composed of 400 g of crushed cassava peels and 400 g of water. The 2nd treatment (T2) is composed of 300 g of peels, 100 g of cow dung and 400 g of water. The 3rd treatment (T3) consists of 200 g peelings, 200 g cow dung and 400 g water. The 4th treatment (T4) is composed of 400 g of effluent and 400 g of water. The 5th treatment (T5) is composed of 300 g of effluent, 100 g of cow dung and 400 g of water. The 6th treatment (T6) is composed of 200 g of effluent, 200 g of cow dung and 400 g of water. A control device composed of 400 g of cow dung and 400 g of water was retained (T0).
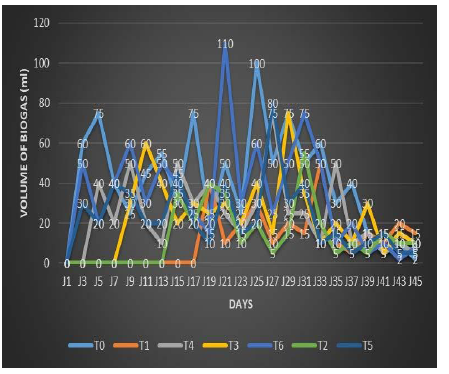
Figure 1 shows the kinetics of biogas production. The maximum biogas productions of treatments T0, T1, T2, T3, T4, T5 and T6 are respectively around 100 ml at day 25, 50 ml at day 33, 55 ml at day 31, 75 ml at day 29, 75 ml at day 27, 80 ml at day 27 and 110 ml at day 21. Biogas production for treatment T1 (100% cassava peel) was nil until day 17 with an appearance on day 19 for a volume of 40 ml.

Figure 1: Daily Production of biogas.
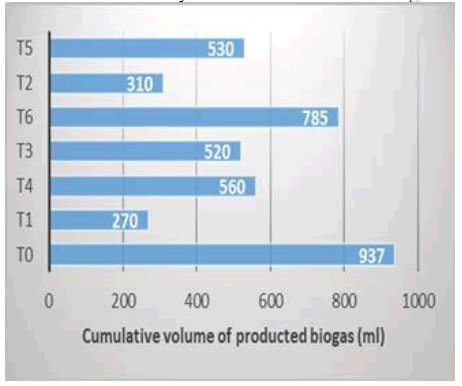
The gas volume went through descending and ascending phases. The peak was observed on day 33 with a volume of 50 ml. From the point of view of cumulative volume (Figure 2), this treatment produced the lowest volume of biogas (270 ml) over the whole period of operation.

Figure 2: Cumulative volume of biogas.
The T2 treatment (75% peel +25% cow dung) also had a late production of biogas until the 13th day with an appearance on the 15th for a volume of 35 ml. As the previous one, the volume of gas knew descending and ascending phases. The peak was observed on the 31st day with a volume of 55 ml. Concerning the T3 treatment (50% peelings +50% cow dung), the gas production occurred on the 11th day of operation with a volume of 60 ml. The volume of gas produced reached a peak of 75 ml on the 29th day. Treatment T4 (100% cassava effluent) produced 40 ml of gas on the 5th day of operation. Gas production in this treatment, like the others, went through ascending and descending phases. The peak was observed on the 27th day with a volume of 75 ml. For treatment T5 (75% cassava effluent +25% cow dung), gas production was observed from day 3. The maximum volume (80 ml) of gas was observed on the 27th day. For treatment T6 (50% cassava effluent +50% cow dung), gas production (50 ml) was recorded from the 3rd day of its launch. The peak of this gas production was reached on the 21st day with the highest gas volume value of 110 ml. As for the T0 treatment (100% cow dung), the gas production (100 ml) was recorded from the 3rd day of its launching. The peak occurred on the 25th day with a volume of 100 ml of gas.
An analysis of the results of the cumulative volumes of biogas production shows globally that the higher the percentage of cow dung addition, the higher the cumulative volume of biogas production. This is the case for treatments T0 (100% cow dung) which produced more biogas (937 ml) over the whole operating period, T6 (50% effluent +50% cow dung) which produced 785 ml and T3 (50% peel +50% cow dung) which produced 520 ml. Treatment T4 (100% effluent) produced 560 ml of cumulative biogas. Descriptive statistics of biogas volume produced by treatment
Table 2 shows the descriptive statistics of biogas obtained per biomass. It shows that 23 observations were made per treatment. Then, it is observed that the averages of biogas volume of treatments T0, T1, T3, T4, T5, and T6 are respectively 40.74 ml on the 25th day, 11.74 ml on the 33rd day, 13.48 ml on the 31st day, 22.61 ml on the 29th day, 24.35 ml on the 27th day, 23.04 ml on the 27th day and 34.13 ml on the 21st day. From the results in this table, it can be stated that the volume of biogas obtained with the control treatment T0 is the highest. However, these results do not allow us to say whether there is a statistically significant relationship between the volumes of biogas obtained from the different biomasses considered. For this purpose, we had carried out an analysis of variance whose results are pre-sented in Table 3.
|
T0 | T1 | T2 | T3 | T4 | T5 | T6 |
|---|---|---|---|---|---|---|---|
| Mean (ml) | 40.74 | 11.74 | 13,48 | 22,61 | 24,35 | 23,04 | 34,13 |
| Maximum (ml) | 100 | 50.00 | 55 | 75 | 75 | 80 | 110 |
| Minimum (ml) | 0 | 0 | 0 | 0 | 0 | 0 | 0 |
| Sum (ml) | 937 | 270.00 | 560,00 | 520,00 | 785,00 | 310,00 | 530,00 |
| Standard deviation | 26.51 | 13.70 | 15,11 | 19,18 | 19,15 | 17,95 | 26,71 |
| Variance | 702.57 | 187.75 | 228,26 | 367,89 | 366,60 | 322,13 | 713,66 |
| Sample size | 23 | 23.00 | 23,00 | 23,00 | 23,00 | 23,00 | 23,00 |
| Sum | 937 | 270 | 310 | 520 | 560 | 530 | 785 |
| Confidence level (95%) | 11.46 | 5.925 | 6,533 | 8,294 | 8,2800 | 7,761 | 11,552 |
Table 2: Descriptive statistics of biogas volume produced per treatment.
In Table 3, we see that the test of homogeneity of variances (P=1.1592E-05) is not significant (>0.0005). We must therefore conclude that the differences in biogas volumes of the treatments are not significant.
| Source of variation | Sum of squares | Mean sum of squares | F | P |
|---|---|---|---|---|
| Inter Groups | 14862.82 | 2477.14 | 6.00 | 1,16E-05 |
| Intra Groups | 63554.87 | 412.70 |
Table 3: Analysis of variance (ANOVA).
In this work, we compared the bio-digestion of cassava peelings and effluents mixed with cow dung. This study showed that biogas production from co-digestion of effluent waste mixed with cow dung is more efficient than that from co-digestion of cassava peel waste mixed with cow dung.
During this study, we were able to determine the optimal conditions of bio-digestion of the bio-masses used. Also, the study indicated that the higher the percentage of cow dung addition, the higher the cumulative volume of biogas production. Finally, the analysis of variance showed that the differences in variances of biogas volumes between treatments were not significant.
The authors would like to thank the famers of cassava processing into gari of the Massavo ifangni cooperative in the South-East of Benin.
Received: 15-Feb-2023, Manuscript No. AJABS-23-89399; , Pre QC No. AJABS-23-89399 (PQ); Editor assigned: 17-Feb-2023, Pre QC No. AJABS-23-89399 (PQ); Reviewed: 03-Mar-2023, QC No. AJABS-23-89399; Revised: 08-Mar-2023, Manuscript No. AJABS-23-89399 (R); Published: 15-Mar-2023, DOI: 10.33980/ajabs.2023.v11i01.01
Copyright: This is an open access article distributed under the terms of the Creative Commons Attribution License, which permits unrestricted use, distribution, and reproduction in any medium, provided the original work is properly cited.